
The honest read on the business,behind the platform
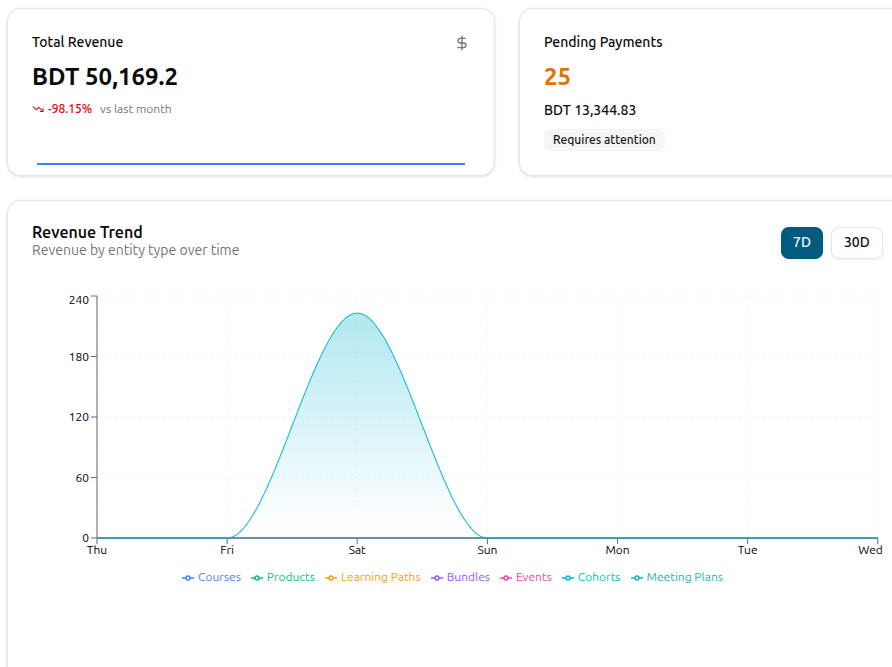
Numbers in spreadsheets get stale fast. Revenue Insights gives you the view that actually matters — total revenue with the change since last month, the daily trend across courses, paths, cohorts, bundles, products and events, where the money's coming from program by program, plus the pending payments and refund requests sitting on your plate. The whole financial picture, on one page, refreshed as orders land.
What you'd actually want to see when you check on the business
We built Revenue Insights around the questions a founder asks on a Monday morning. How much did we make? Is that more or less than last month? What's selling? What's not? What's stuck? Each one is a tile or a chart, and each one updates as orders come in.
Total Revenue, With the Change
The headline number — total revenue this period — paired with the change against the period before, in both percent and dollars. The first thing you read.
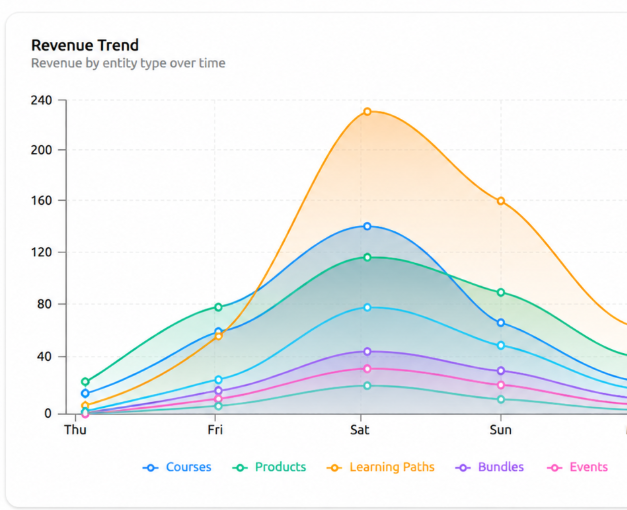
Daily Trend by Program Type
Seven days or thirty days, broken out by courses, paths, cohorts, bundles, products, events and meeting plans. Spot which line's climbing and which is flat.
Where the Money Comes From
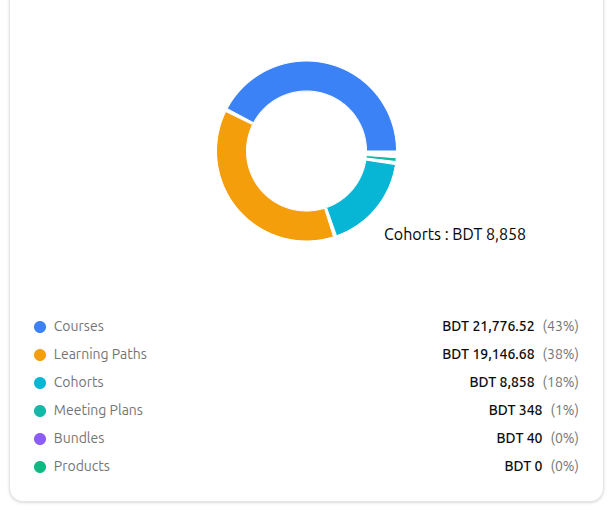
A clean distribution showing how your revenue splits across program types — by name, by value, by percentage of the total.
Top Programs by Revenue
A leaderboard of the programs pulling in the most — courses, paths and cohorts side by side, with the parent program shown for cohort rows.
Pending and Refunds at a Glance
What's not yet paid (pending payments) and what's owed back (refund requests) — both with counts and totals, so nothing surprises you at quarter end.
Pricing Mix — What's Actually Selling
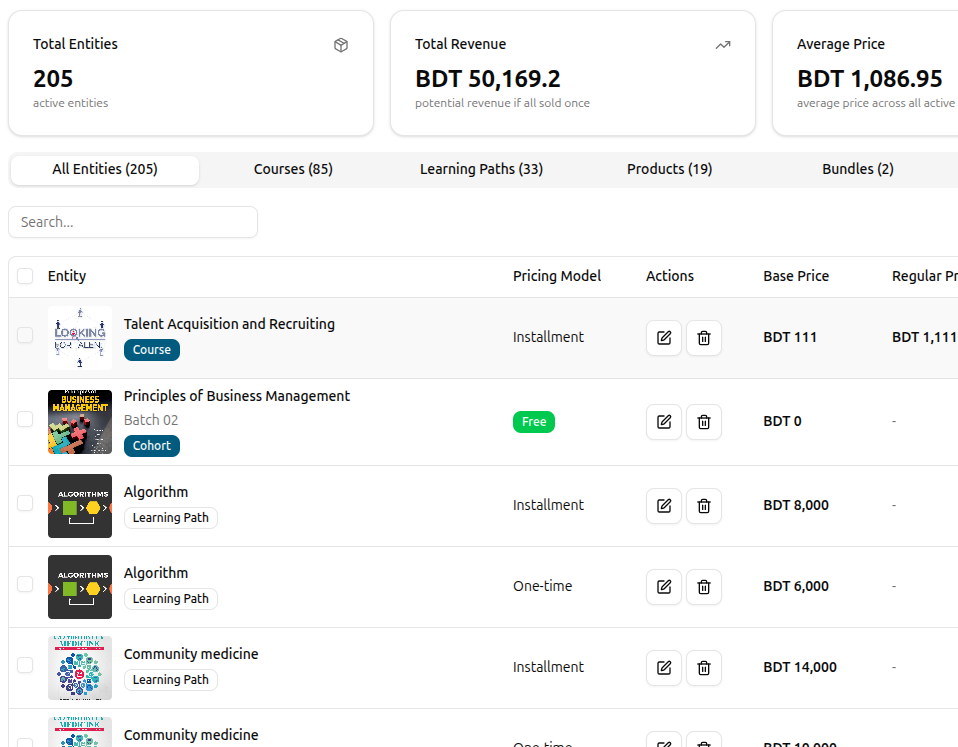
How many courses are paid, how the popular pricing model breaks down (one-time, subscription, installment, free), and the average price across the catalogue.
The headline first — is the business moving the right way?
One glance and you know where the month stands. Total revenue front and centre, the change since last period right beside it, an arrow pointing up or down so there's no second-guessing the direction. Pending payments and refund requests sit just underneath — the money in motion, so nothing slips while you're focused on what already cleared. It's the morning gut-check, in one screen, before the day even starts.
Today's revenue at a glance — no maths, no spreadsheets
Up or down vs last month, in percent and dollars
Money still in motion — pending payments, refund requests
The whole financial pulse, on one screen
The trend, broken out by what's actually selling
Stop guessing which product is doing the heavy lifting. The trend chart paints the last seven or thirty days in seven colours — one for each program type — so you can see at a glance whether your courses are flat while cohorts are climbing, or whether a single bundle quietly carried the month. Hover any day and the full breakdown appears. The line that's rising is the one to invest in next.
See seven days or thirty, with one click
Every program type in its own colour, its own story
Hover any day for the full per-product breakdown
Find the line pulling the business — and the one stalling
Where the money actually comes from, program by program
The big surprises rarely come from the top of the leaderboard. The distribution chart shows the shape of your business — courses 42%, bundles 18%, events 12% — and the top-programs table goes deeper, naming every course, path and cohort with the revenue it earned. Cohorts show the parent program right alongside, so context is never missing. Find the quiet earner. Find the one that should be earning more.
See the shape of your revenue at a glance
Drill into every course, path and cohort by name
Cohorts always show their parent course or path
Spot the quiet earners — and the underperformers
Pricing mix — what shape your catalogue is actually taking
Revenue tells you what worked. Pricing tells you why. See how many programs you've priced across the catalogue, the average price-tag, and which model your audience actually picks — subscription, one-time, installment or free — with the exact percentage. Pair it with the per-product counts and the strategy reveals itself: are you a course platform, a cohort platform, or quietly becoming a subscription business?
Catalogue-wide pricing in one card — no digging required
Average price across everything you sell
The pricing model your audience actually chooses
Catalogue shape — by program type, at a glance
Price it, take the payment, watch the revenue land
Revenue Insights starts the moment you price a program. Set the price, collect the money — online or offline — and every payment shows up in your numbers automatically.
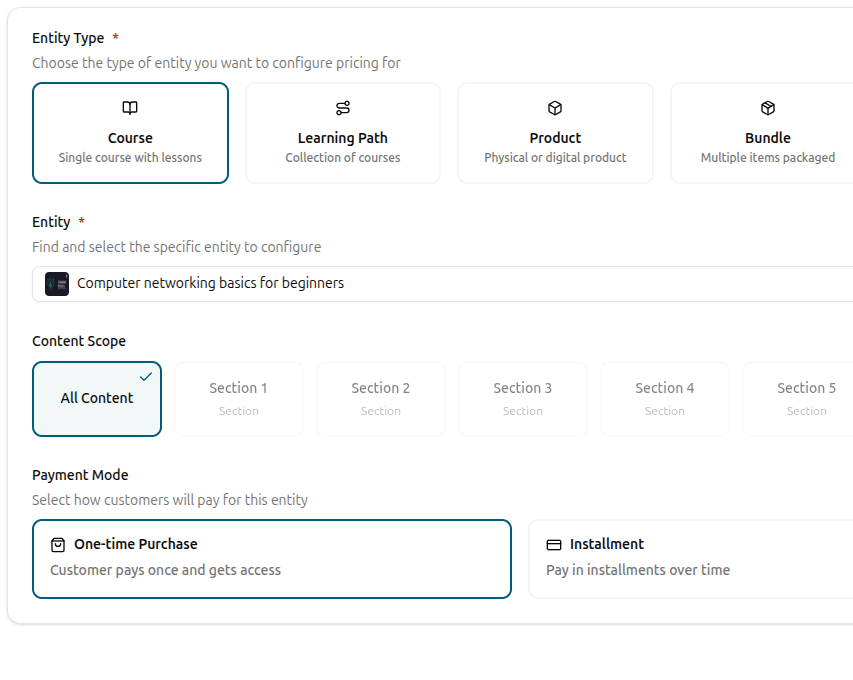
Set the price, pick the model
Choose what you're selling — a course, a learning path, a cohort, a bundle, a product or an event. Pick the pricing model that fits — one-time, subscription, installment, or free for the lead magnets. Save it once and the program is ready to earn.
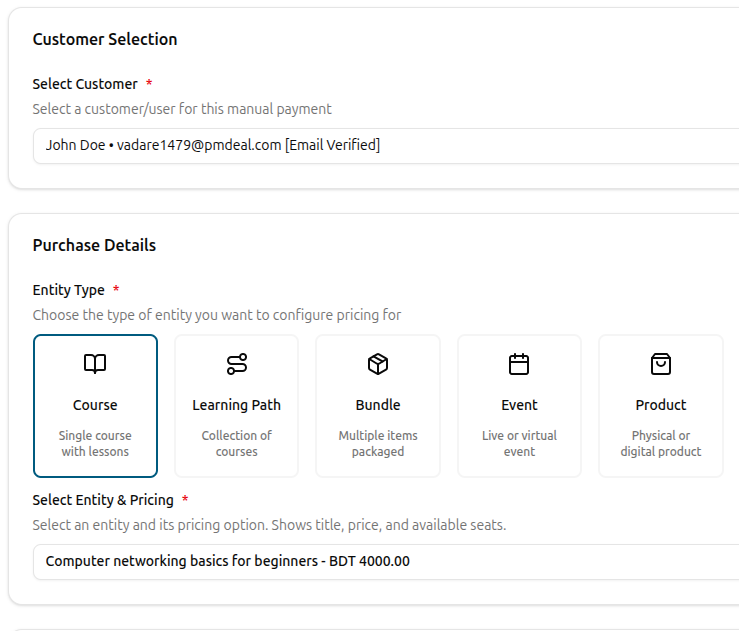
Log the offline payments too
When a learner pays you outside the gateway — bank transfer, cash, an installment cleared by hand — log it in seconds. Pick the customer, pick the program, mark it paid. The revenue counts from the second it lands.
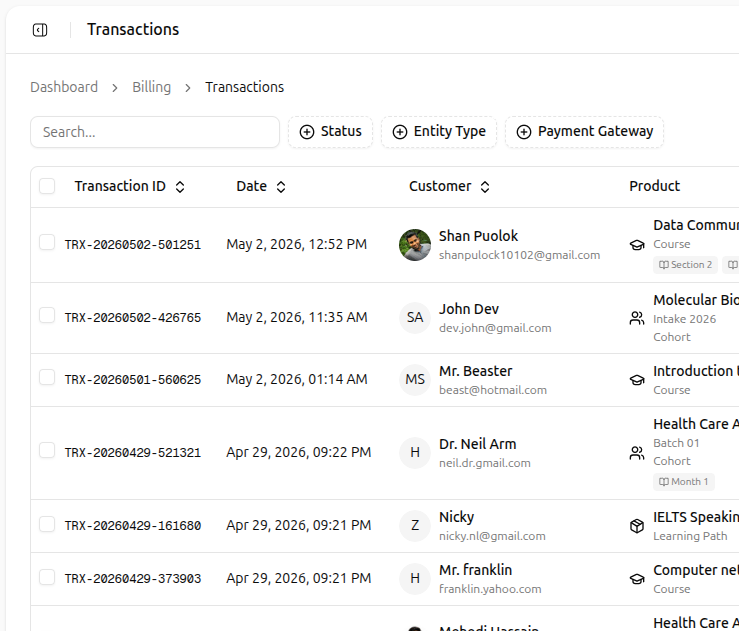
See every transaction in one place
Online or offline, every payment shows up in a single feed — newest first, with the customer, the program and the amount. Filter by status, gateway or product type, search any transaction ID. Nothing slips through the cracks.
Revenue Insights FAQ
What founders, operators and finance partners ask the first time they sit down with the numbers.
Can't find what you're looking for?
Contact Sales

Start Building Learning Your Way
Set up courses, programs, and learning experiences without forcing your process into rigid software. A connected system for students, educators, and administrators.
Build Your Academy